- Details
- Written by Luca Pantano
- Category: Remote Sensing
- Hits: 11941
The creation of a composition between the visible and the panchromatic data is shown, using an image recorded in November 2002 from the sensor Landsat Enhanced Thematic Mapper Plus (ETM +) on Landsat 7 satellite platform, covering the Italian region Puglia.
The ETM multispectral sensor allows measurements for various bands with different accuracy on the ground:
- 30m for the visible, near and medium IR bands (bands 1, 2, 3, 4, 5 and 7)
- 15m for the panchromatic band (band 8)
- 60m on the thermal IR band (bands 6-1 and 6-2)
The greater panchromatic sensor accuracy is due to the ability to collect more reflected energy because of its bandwidth (visible and near IR). Clearly, the signal generated by the panchromatic sensor contains only the information of light intensity, without distinction of color tone.
However, it is possible to integrate this data with the information coming from the three bands in the visible spectrum (bands 3, 2 and 1) so as to obtain a representation having the geometrical precision of the panchromatic band (15m) and the color (tone and saturation) of the other multispectral bands.
Into practice, the following procedure has to be followed:
- create a composition in natural color RGB 321 (band 3 in Red channel, band 2 in Green channel, bad 1 in blue channel);
- change the color reference system from RGB (Red, Green, Blue) to HSI (Hue, Saturation, Intensity);
- then replace the information related to the intensity with the data from the panchromatic band.
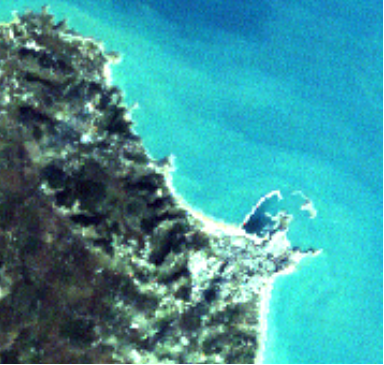
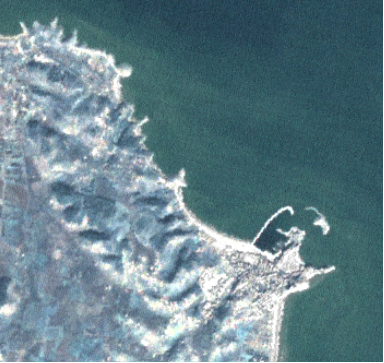
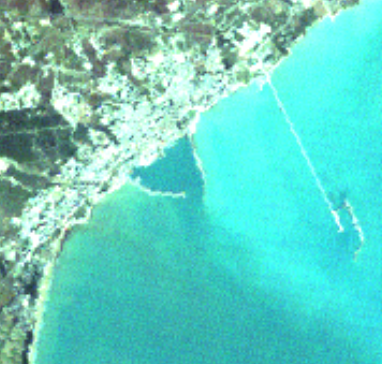
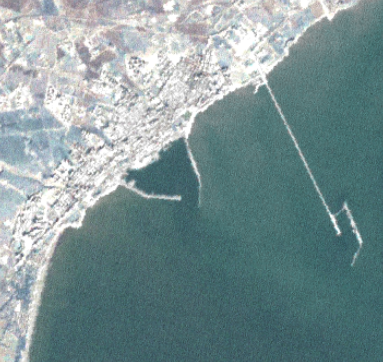
Compare the following pairs of pictures, with the first ones obtained using the three visible bands (Red, Green, Blue - bands 3,2,1), while the second ones made using also the panchromatic band as intensity data (I - band 8 ).
As may be seen, the last containing a higher geometric information and allows to read better the structure of the territory.

Vieste - RGB : 321

Vieste - RGB + I : 321 + 8

Manfredonia - RGB : 321

Manfredonia - RGB + I : 321 + 8


